NAS Dashboard
A small live dashboard for my home NAS that answers "what is it doing, how full is it, is it healthy?" in a couple of seconds, opened from the app launcher whenever I hear the drives working.
I run a four-bay NAS at home: RAID 6 under btrfs, nightly backups pulled from my PC, a media library, and a handful of my own scripts for fans, temperatures and maintenance.
It worked, but it was a black box. I’d hear the drives grinding away and have no idea why without opening a terminal, and I couldn’t tell how much of the pool the old backup snapshots were quietly holding on to.
So the brief I wrote for myself was very narrow: something I open from the launcher when I’m curious, glance at, and close. Success meant answering three questions within a couple of seconds of opening it:
SpaceHow full is it, and what's taking the space?
JobsIs anything running right now, how far along is it, and did recent jobs succeed?
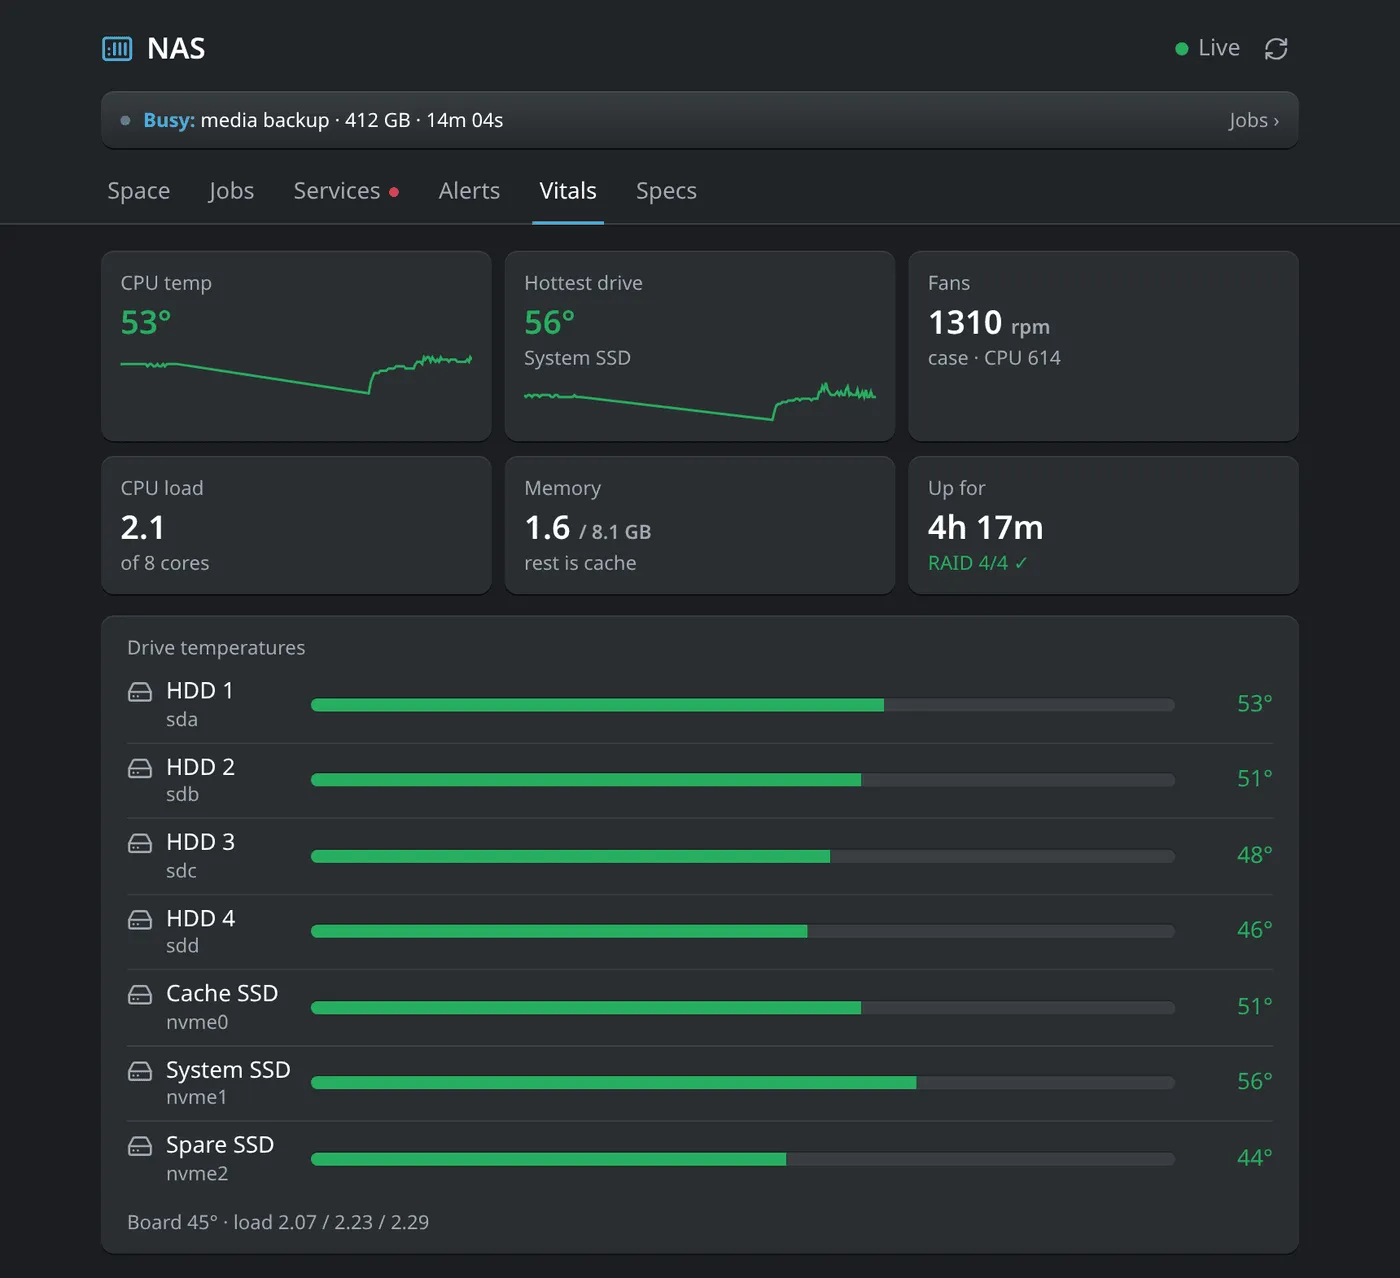
VitalsIs the hardware healthy: temperatures, fans, RAID, load?
Those became the first three tabs, plus a busy banner across the top whenever something is running, so the most common question (“what’s that noise?”) gets answered before I click anything.
Keeping it that narrow took a deliberate cut. The first plan also tracked every other bit of disk activity, like file copies and media playback, and tried to name the process behind it. I dropped that before building anything: I already know when I’m copying a file or watching something, so the dashboard only needs to explain the work the NAS does on its own.
Measuring without making the noise
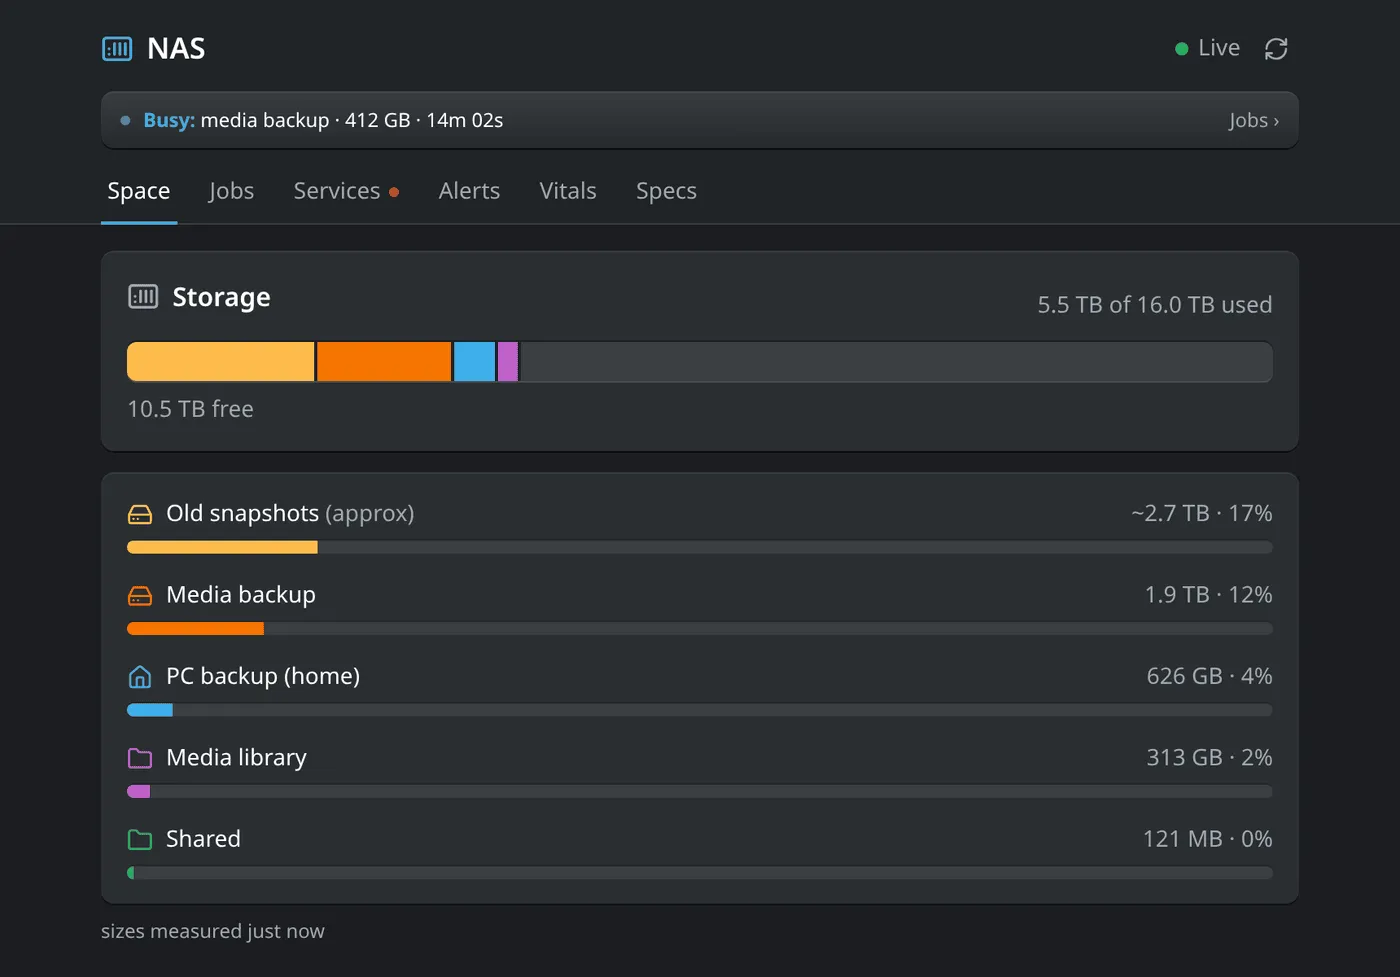
The Space tab is one stacked bar for the whole pool, iOS-storage style, then a row per section with its own bar in the same colour.
The catch is that working out folder sizes on terabytes of data means scanning the disks, which makes exactly the drive noise the dashboard exists to explain. So there’s no polling. Sizes are measured when the service starts and again only after a backup or a download finishes, at the lowest disk priority.
The trade-off is that the number can be a few hours old, so it says so, with a “measured 3 h ago” note next to it. Slightly stale and honest felt better than fresh and noisy.
“Old snapshots” can’t be measured cheaply at all, so it’s shown as what it is: an estimate (used space minus everything else), labelled “approx” in the UI rather than presented as a precise figure.
No fake precision
A rule from the start was that the UI should never claim to know more than it does.
A backup is an rsync run, and rsync doesn’t know its total size up front, so a running backup gets a barber-pole bar with “412 GB written · 85 MB/s · 14m 02s” rather than a made-up percentage. Files synced down from online services do know their size, so they get a real percentage bar.
The connection status works the same way. Instead of an “updated 3 s ago” counter ticking away in the corner, the header says Live, Stale, Collector stopped or Can’t reach NAS, because those are the states that actually change what I should do next.
Jobs started out as a card per job with a row of status dots, and ended up as a single chronological timeline: what’s running now at the top with progress, then everything else grouped by day, with failures in red and a plain-English reason (“my PC was off or unreachable”).
Buttons, carefully
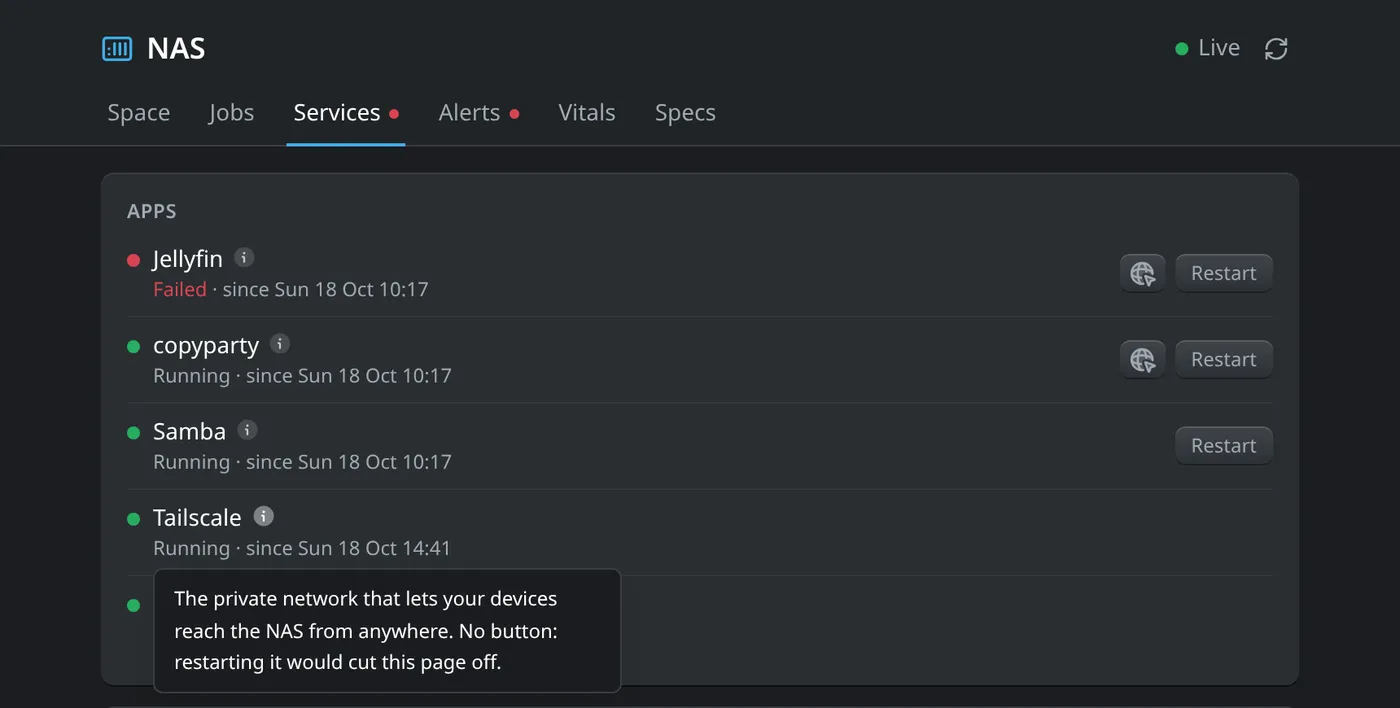
Version one was strictly read-only, on purpose: a bug in a dashboard shouldn’t be able to touch the data. Once I was using it, though, the obvious next step after “Jellyfin has failed” was “restart Jellyfin”, so the Services tab got Restart and Run buttons, with a red dot on the tab if anything has failed.
They’re deliberately limited. A press goes through a whitelist in the web server, which drops a request file; the root-owned collector checks the same whitelist again before running anything.
Tailscale, SSH, the firewall and the dashboard’s own web server have no buttons at all, because restarting them from the page would cut off the page you pressed it from. Rather than leaving that as an unexplained gap, every row has an info tooltip that says what the service does and, where relevant, why there’s no button.
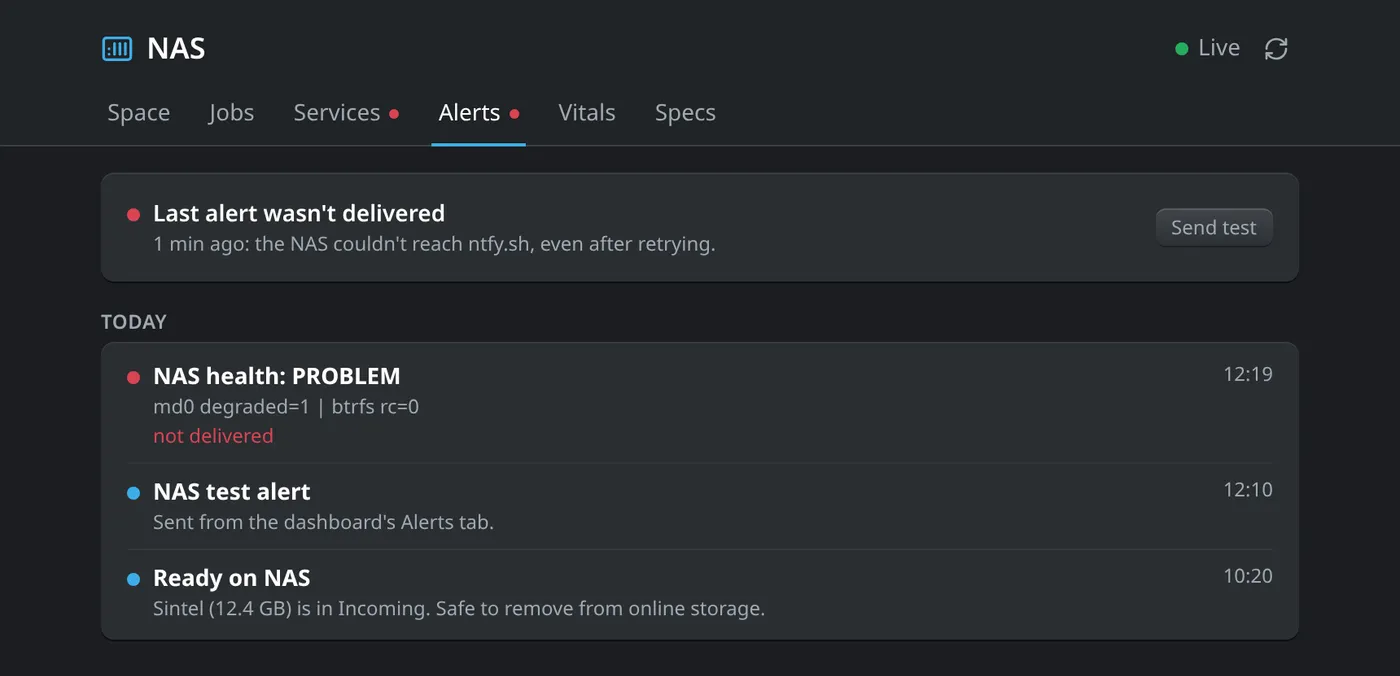
The Alerts tab exists because phone notifications fail silently: if the NAS can’t reach the notification service, I’d never know I’d missed something. It lists every alert it tried to send, flags the ones that didn’t get through, and has a Send test button.
Vitals colours temperatures using the same thresholds as the scripts that send overheat alerts, so the dashboard and my phone never disagree about what “too hot” means.
How it’s built
I split it in two so the part that faces the network can’t do much harm. A collector with full access reads what the NAS already records (backup logs, scheduled jobs, RAID state, the temperature log) and writes a fresh snapshot every few seconds. A separate web server with no special permissions serves the page and streams those snapshots to it live.
Both are plain Python with no extra packages, so nothing new has to be installed on the NAS. The front end is plain HTML and JavaScript with one module per tab, styled with Tailwind, and the CSS is built on my PC so nothing Node-related goes on the server either.
It’s only reachable over my private network, and on my desktop it’s a launcher app with its own themed browser profile and the browser buttons hidden, so it feels like a native app rather than a tab. A lot of the commit history is visual polish: cards lit from the top edge, recessed progress tracks, Aqua-style glossy fills.
Where it’s at
It’s deployed and in daily use, now at six tabs (Services, Alerts and a hardware Specs tab joined the original three).
The latest fix was for reboots: the collector was starting before the storage pool had mounted, so it now waits and shows a spinner instead of half-empty tabs. A sample-data script lets me iterate on the UI locally without touching the NAS, which is also how these screenshots were made.